

# Getting Started Datadog with AWS Services


Datadog is a monitoring and analytics tool used by Information Technology (IT) and DevOps teams to determine performance metrics and event monitoring for infrastructure and cloud services. The tool can monitor resources such as servers, databases, and tools.
Important Terms :-
i)HOST :- A network host is a computer other device connected to a computer network. A host may work as a server offering information resources, services, and applications to users or other hosts on the network. Hosts are assigned at least one network address. That we can use for monitoring in Datadog.
ii)DATADOG AGENT :- It is a Datadog agent is a service that runs alongside the application software system. That is, it runs alongside the host to collect various events and metrics from it and sends it to the cloud via Internet.
iii)DATADOG TAGS:- Datadog tags are labels or identifiers added to hosts or other resources to help organize and group them for monitoring and analysis. Example :- version:dev , version:stage , version:prod .
#Datadog Architecture with AWS Services

Fig. Datadog Architecture diagram with AWS Services
#Integration of Datadog Agent with AWS EC2
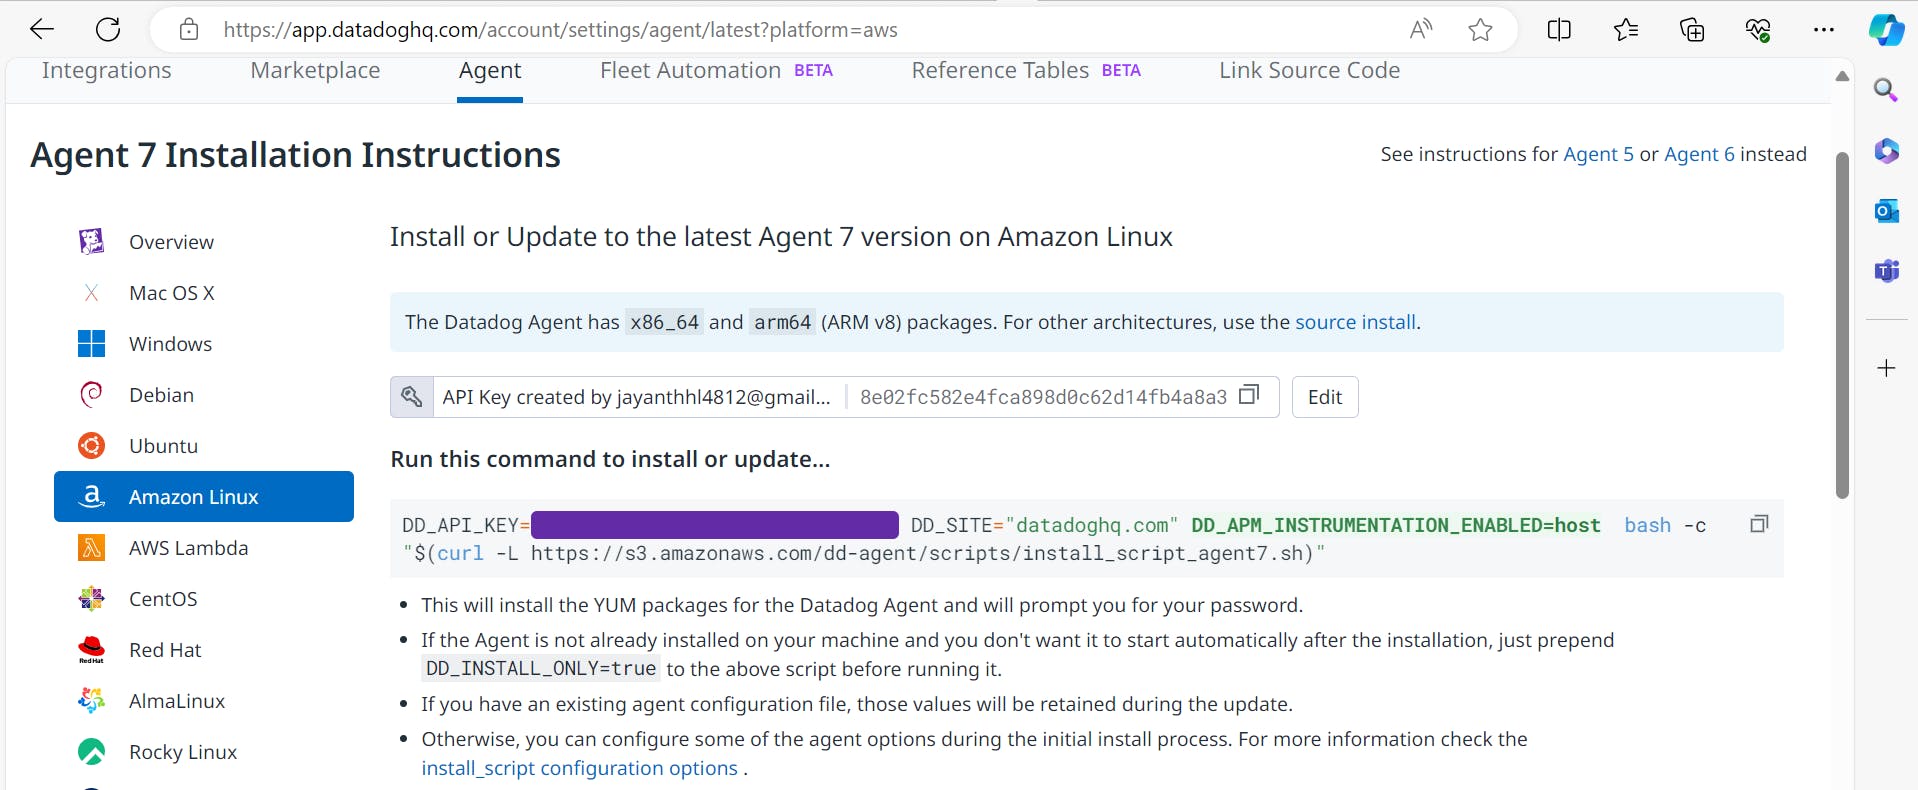
How to install datadog agent in Amazon Linux?
Create an account by visiting datadoghq.com
Create an AWS EC2 instance (Amazon Linux 2).
Copy and run the below command in EC2 machine.
Use the command
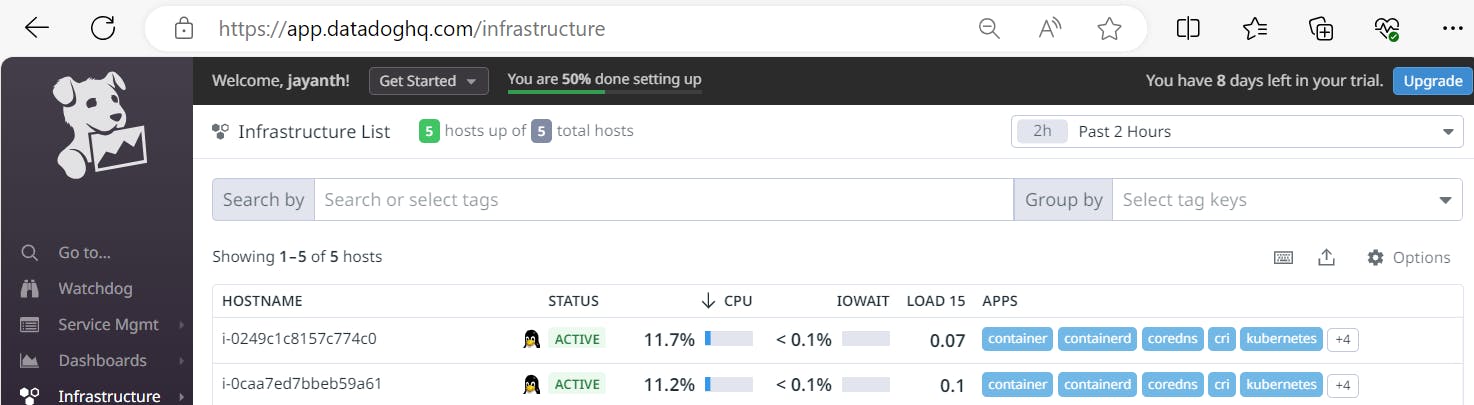
sudo service datadog-agent startto start the agent as a service and use the command to check the statussudo service datadog-agent status.We can see our host in the Infrastructure list :-

#Live Process monitoring in Datadog Agent:-
Initially , we can see that there are no processes.
In the Amazon Linux server , we have to run the following commands to check the processes running:
cd /etc/datadog-agent
sudo vim datadog.yaml
Then we have to do the following changes in the datadog.yaml file
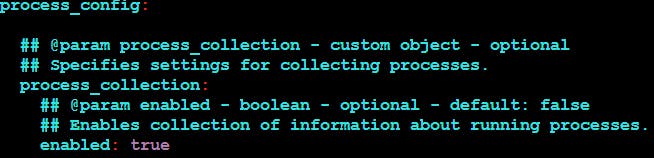
Then we need to restart the datadog agent using the command
sudo service datadog-agent restart
- Now we can see the processes :-

# Enabling Network Performance Monitoring
Initially we see that Network Performance Monitoring isn't enabled :-

In order to enable the NPM , Copy the system-probe example configuration:
sudo -u dd-agent install -m 0640 /etc/datadog-agent/system-probe.yaml.example /etc/datadog-agent/system-probe.yamlEdit
/etc/datadog-agent/system-probe.yamlto set the enable flag totruenetwork_config: # use system_probe_config for Agent's older than 7.24.1 ## @param enabled - boolean - optional - default: false ## Set to true to enable Network Performance Monitoring. # enabled: true
Then we need to restart the datadog agent using the command
sudo service datadog-agent restart
# Observe CPU and Memory utilization of EC2 machine
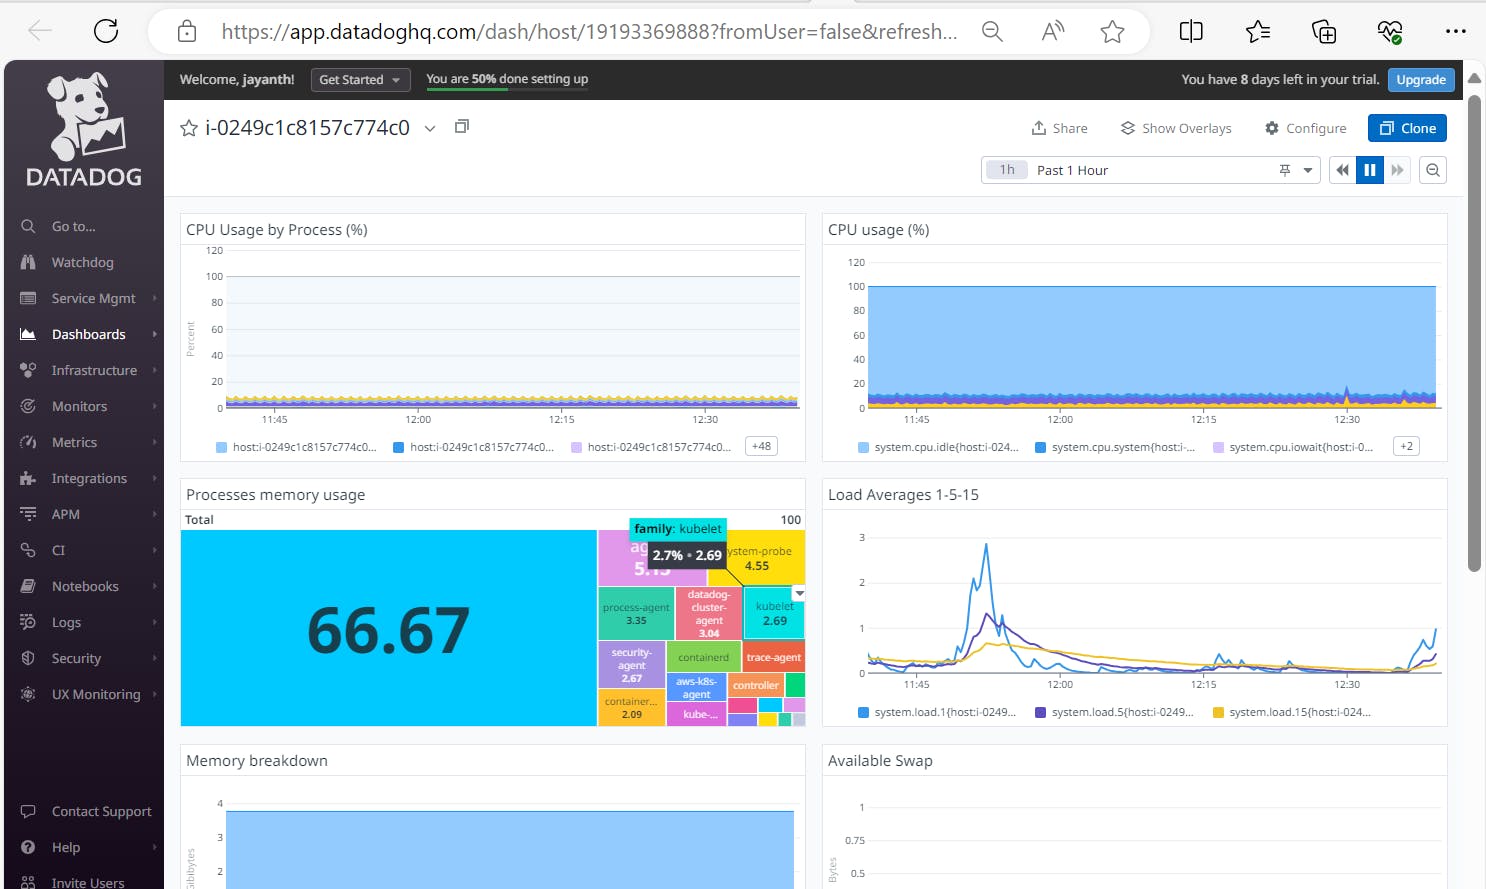
Finally! You are now able to view the EC2 Instance in Datadog!
Navigate to the ‘Infrastructure List’ dropdown, then select ‘AWS EC2 machine’. You should see a dashboard metric like this:
Navigate to metrics explorer tab in Datadog Server. And select host IP to check the required parameters.
For example: Memory and CPU utilization

#Integration of Datadog Agent with AWS RDS
Create an AWS RDS instance. Ensure that you select the PostgreSQL engine. I utilized a free-tier eligible db.t3.micro instance running PostgreSQL 16.2 for this demonstration. Ensure you allow Public Access, as we will use that capability to load the database from your Amazon Linux machine.
Navigate to the IAM Policies page and select ‘Create Policy’. Select to add policy by JSON, enter the following into the editor, name the policy DatadogIntegrationPolicy, and save it.
 {
     "Version": "2012-10-17",
     "Statement": [
         {
             "Action": [
                 "apigateway:GET",
                 "autoscaling:Describe*",
                 "backup:List*",
                 "budgets:ViewBudget",
                 "cloudfront:GetDistributionConfig",
                 "cloudfront:ListDistributions",
                 "cloudtrail:DescribeTrails",
                 "cloudtrail:GetTrailStatus",
                 "cloudtrail:LookupEvents",
                 "cloudwatch:Describe*",
                 "cloudwatch:Get*",
                 "cloudwatch:List*",
                 "codedeploy:List*",
                 "codedeploy:BatchGet*",
                 "directconnect:Describe*",
                 "dynamodb:List*",
                 "dynamodb:Describe*",
                 "ec2:Describe*",
                 "ec2:GetTransitGatewayPrefixListReferences",
                 "ec2:SearchTransitGatewayRoutes",
                 "ecs:Describe*",
                 "ecs:List*",
                 "elasticache:Describe*",
                 "elasticache:List*",
                 "elasticfilesystem:DescribeFileSystems",
                 "elasticfilesystem:DescribeTags",
                 "elasticfilesystem:DescribeAccessPoints",
                 "elasticloadbalancing:Describe*",
                 "elasticmapreduce:List*",
                 "elasticmapreduce:Describe*",
                 "es:ListTags",
                 "es:ListDomainNames",
                 "es:DescribeElasticsearchDomains",
                 "events:CreateEventBus",
                 "fsx:DescribeFileSystems",
                 "fsx:ListTagsForResource",
                 "health:DescribeEvents",
                 "health:DescribeEventDetails",
                 "health:DescribeAffectedEntities",
                 "kinesis:List*",
                 "kinesis:Describe*",
                 "lambda:GetPolicy",
                 "lambda:List*",
                 "logs:DeleteSubscriptionFilter",
                 "logs:DescribeLogGroups",
                 "logs:DescribeLogStreams",
                 "logs:DescribeSubscriptionFilters",
                 "logs:FilterLogEvents",
                 "logs:PutSubscriptionFilter",
                 "logs:TestMetricFilter",
                 "organizations:Describe*",
                 "organizations:List*",
                 "rds:Describe*",
                 "rds:List*",
                 "redshift:DescribeClusters",
                 "redshift:DescribeLoggingStatus",
                 "route53:List*",
                 "s3:GetBucketLogging",
                 "s3:GetBucketLocation",
                 "s3:GetBucketNotification",
                 "s3:GetBucketTagging",
                 "s3:ListAllMyBuckets",
                 "s3:PutBucketNotification",
                 "ses:Get*",
                 "sns:List*",
                 "sns:Publish",
                 "sqs:ListQueues",
                 "states:ListStateMachines",
                 "states:DescribeStateMachine",
                 "support:DescribeTrustedAdvisor*",
                 "support:RefreshTrustedAdvisorCheck",
                 "tag:GetResources",
                 "tag:GetTagKeys",
                 "tag:GetTagValues",
                 "xray:BatchGetTraces",
                 "xray:GetTraceSummaries"
             ],
             "Effect": "Allow",
             "Resource": "*"
         }
     ]
 }
Next, create an EC2 instance which you will use to host the Datadog Agent, allowing for resource metric information to be passed from the RDS instance to Datadog. For this demonstration, I utilized a free tier t2.mirco Amazon Linux instance.
After creating the instance, navigate to the Datadog Agent Installations Instructions page (via the Integrations dropdown) and click ‘Select API Key’. Click on the key, followed by the ‘Use this Key’ button. Then, copy the command in the window, which you will use in your EC2 instance to download the Datadog Agent.
Next, we need to install PostgreSQL on the instance.
sudo dnf install postgresql15Next, connect our EC2 instance to your RDS instance. Do this by navigating to your RDS instance in the AWS Console, selecting ‘Actions’ followed by ‘Set up EC2 connection’.
Next, navigate back to our EC2 instance and run the following commands to create a Datadog user in your database and grant it the appropriate roles:
psql -h <RDS Instance Endpoint> --port 5432 -U postgres
CREATE USER datadog WITH password '<PASSWORD>';
ALTER ROLE datadog INHERIT;
CREATE SCHEMA datadog;
GRANT USAGE ON SCHEMA datadog TO datadog;
GRANT USAGE ON SCHEMA public TO datadog;
GRANT pg_monitor TO datadog;
CREATE EXTENSION IF NOT EXISTS pg_stat_statements schema public;
CREATE OR REPLACE FUNCTION datadog.explain_statement(
   l_query TEXT,
   OUT explain JSON
)
RETURNS SETOF JSON AS
$$
DECLARE
curs REFCURSOR;
plan JSON;

BEGIN
   OPEN curs FOR EXECUTE pg_catalog.concat('EXPLAIN (FORMAT JSON) ', l_query);
   FETCH curs INTO plan;
   CLOSE curs;
   RETURN QUERY SELECT plan;
END;
$$
LANGUAGE 'plpgsql'
RETURNS NULL ON NULL INPUT
SECURITY DEFINER;
Exit the psql shell and enter the following commands in your EC2 instance to confirm that the connection is working properly:
psql -h localhost -U datadog postgres -A \
  -c "select * from pg_stat_database limit 1;" \
  && echo -e "\e[0;32mPostgres connection - OK\e[0m" \
  || echo -e "\e[0;31mCannot connect to Postgres\e[0m"
psql -h localhost -U datadog postgres -A \
  -c "select * from pg_stat_activity limit 1;" \
  && echo -e "\e[0;32mPostgres pg_stat_activity read OK\e[0m" \
  || echo -e "\e[0;31mCannot read from pg_stat_activity\e[0m"
psql -h localhost -U datadog postgres -A \
  -c "select * from pg_stat_statements limit 1;" \
  && echo -e "\e[0;32mPostgres pg_stat_statements read OK\e[0m" \
  || echo -e "\e[0;31mCannot read from pg_stat_statements\e[0m"
The last step to enable monitoring is to configure the metrics that will be monitored by the Datadog agent, which you will do via the postgres.d/conf.yaml file. You can edit this file using the following command:
sudo vim etc/datadog-agent/conf.d/postgres.d/conf.yaml
Edit the file to contain the following, which will allow datadog to monitor the database as well as to track the schema of any tables in the database:
init_config:
instances:
  - dbm: true
    host: '<YOUR RDS ENDPOINT>'
    port: 5432
    username: datadog
    password: '<PASSWORD FOR DATADOG>'
    database_autodiscovery:
      enabled: true
    collect_schemas:
      enabled: true
    relations:
      - relation_regex: .*
    tags:
      - "dbinstanceidentifier:<DATABASE IDENTIFIER (NOT ENDPOINT)>"
Finally! We are now able to view the database dashboard in Datadog! Navigate to the ‘Infrastructure List’ dropdown, then select ‘AWS RDS Endpoint’.
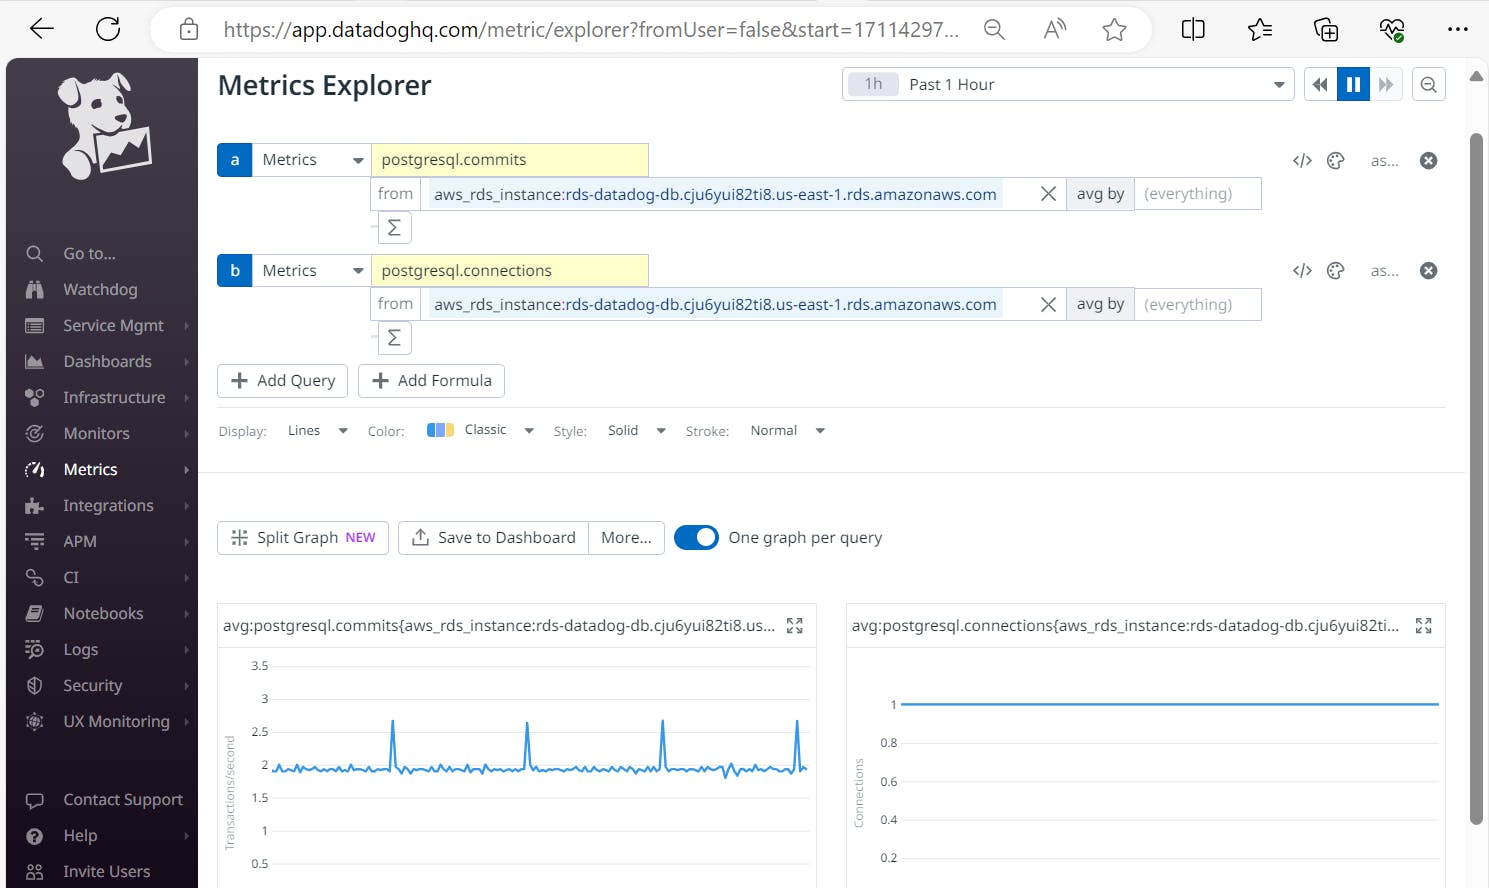
Navigate to metrics explorer tab in Datadog Server. And select DB Endpoint to check the required parameters.
Now we should see a dashboard metric like this:
#Integration of Datadog Agent with AWS EKS
Create AWS EKS Cluster with required IAM Roles to integrate Kubernetes cluster with Datadog Agent.
Kubernetes clusters managed by Amazon EKS make calls to other AWS services on your behalf to manage the resources that you use with the service. Before you can create Amazon EKS clusters, you must create an IAM role with the AmazonEKSClusterPolicy
To create your Amazon EKS cluster role in the IAM console
Open the IAM console at https://console.aws.amazon.com/iam/
Choose Roles, then Create role.
Under Trusted entity type, select AWS service.
From the Use cases for other AWS services dropdown list, choose EKS.
Choose EKS — Cluster for your use case, and then choose Next.
On the Add permissions tab, choose Next.
For Role name, enter a unique name for your role, such as EksClusterServiceRole.
Choose Create Role.
Create Amazon EKS Node IAM Role
The Amazon EKS node
kubeletdaemon makes calls to AWS APIs on your behalf. Nodes receive permissions for these API calls through an IAM instance profile and associated policies. Before you can launch nodes and register them into a cluster, you must create an IAM role for those nodes to use when they are launched. This requirement applies to nodes launched with the Amazon EKS optimized AMI provided by Amazon, or with any other node AMIs that you intend to use.You must create an IAM role (AmazonEKSNodeRole) with the following IAM policies:
AmazonEKSWorkerNodePolicy
AmazonEC2ContainerRegistryReadOnly
CloudWatchLogsFullAccess
AmazonEKS_CNI_Policy
To create your Amazon EKS node role in the IAM console.
Open the IAM console at https://console.aws.amazon.com/iam/
In the left navigation pane, choose Roles.
On the Roles page, choose Create role.
On the Select trusted entity page, do the following:
In the Trusted entity type section, choose AWS service.
Under Use case, choose EC2, Choose Next.
On the Add permissions page, do the following:
In the Filter policies box, enter
AmazonEKSWorkerNodePolicy.Select the check box to the left of AmazonEKSWorkerNodePolicy in the search results.
Choose Clear filters, In the Filter policies box, enter
AmazonEC2ContainerRegistryReadOnly.Select the check box to the left of AmazonEC2ContainerRegistryReadOnly in the search results.
Search for AmazonEKS_CNI_Policy and select the check box,Choose Next
On the Name, review, and create page, do the following:
For Role name, enter a unique name for your role, such as
AmazonEKSNodeRole.Choose Create role.
Create Cluster Nodegroups
Your Amazon EKS cluster can schedule pods on any combination of
Self-managed nodes,
Amazon EKS Managed node groups, and
AWS Fargate.
Here we will go with the 2nd option Amazon EKS Managed node groups.
Wait for your cluster status to show as
ACTIVE. We can't create a managed node group for a cluster that isn't alreadyACTIVE.Open the Amazon EKS console at https://console.aws.amazon.com/eks/home#/clusters
Choose the name of the cluster that you want to create a managed node group in.
Select the Compute tab, Choose Add node group.
Review and Create
On the Review and create page, review your managed node group configuration and choose Create.
Configure kubectl for Amazon EKS
Launch one EC2 machine, connect it with CMD, and install kubectl, iam-authenticator, AWS Cli on this machine.Install kubectl:
https://docs.aws.amazon.com/eks/latest/userguide/install-kubectl.html
Install & Configure aws cli use the below command:
aws configureConnects to EKS Cluster
After you create your Amazon EKS cluster, you must configure your kubeconfig file with the AWS Command Line Interface (AWS CLI). This configuration allows you to connect to your cluster using the kubectl command line.
Check the current identity to verify that you’re using the correct credentials that have permissions for the Amazon EKS cluster:
aws sts get-caller-identity
Create or update the kubeconfig file for your cluster
aws eks - - region <AWS_REGION_CODE> update-kubeconfig - - name <EKS_CLUSTER_NAME>
Install and Configure Datadog Agent on Kubernetes with Daemon set.
To install the Datadog Agent on your Kubernetes cluster:
Configure Agent permissions: If your Kubernetes has role-based access control (RBAC) enabled, configure RBAC permissions for your Datadog Agent service account. From Kubernetes 1.6 onwards, RBAC is enabled by default. Create the appropriate ClusterRole, ServiceAccount, and ClusterRoleBinding with the following command:
kubectl apply -f "https://raw.githubusercontent.com/DataDog/datadog-agent/master/Dockerfiles/manifests/rbac/clusterrole.yaml"

kubectl apply -f "https://raw.githubusercontent.com/DataDog/datadog-agent/master/Dockerfiles/manifests/rbac/serviceaccount.yaml"

kubectl apply -f "https://raw.githubusercontent.com/DataDog/datadog-agent/master/Dockerfiles/manifests/rbac/clusterrolebinding.yaml"
Create the Datadog Agent manifest with supported OS.
For example Linux:sudo vi datadog-agent.yaml.Copy the manifest template from below reference link:
https://docs.datadoghq.com/resources/yaml/datadog-agent-all-features.yaml
In the
secret-api-key.yamlmanifest, replacePUT_YOUR_BASE64_ENCODED_API_KEY_HEREwith your Datadog API key encoded in base64. To get the base64 version of your API key, you can run:echo -n '<Your API key>' | base64If you are using the
datadog-agent.yamlmanifest template: in thesecret-cluster-agent-token.yamlmanifest, replacePUT_A_BASE64_ENCODED_RANDOM_STRING_HEREwith a random string encoded in base64. To get the base64 version of it, you can run:echo -n 'Random string' | base64Set your Datadog site to
datadoghq.comusing theDD_SITEenvironment variable in thedatadog-agent.yamlmanifest.Note: If the
DD_SITEenvironment variable is not explicitly set, it defaults to theUSsitedatadoghq.com. If you are using one of the other sites, this results in an invalid API key message. Refer below documentation.Deploy the DaemonSet with the command:
kubectl apply -f datadog-agent.yamlVerification: To verify the Datadog Agent is running in your environment as a DaemonSet, execute:
kubectl get daemonsetFinally! We are now able to view the Kubernetes dashboard in Datadog! Navigate to the ‘Infrastructure List’ dropdown, then select ‘Kubernetes’.
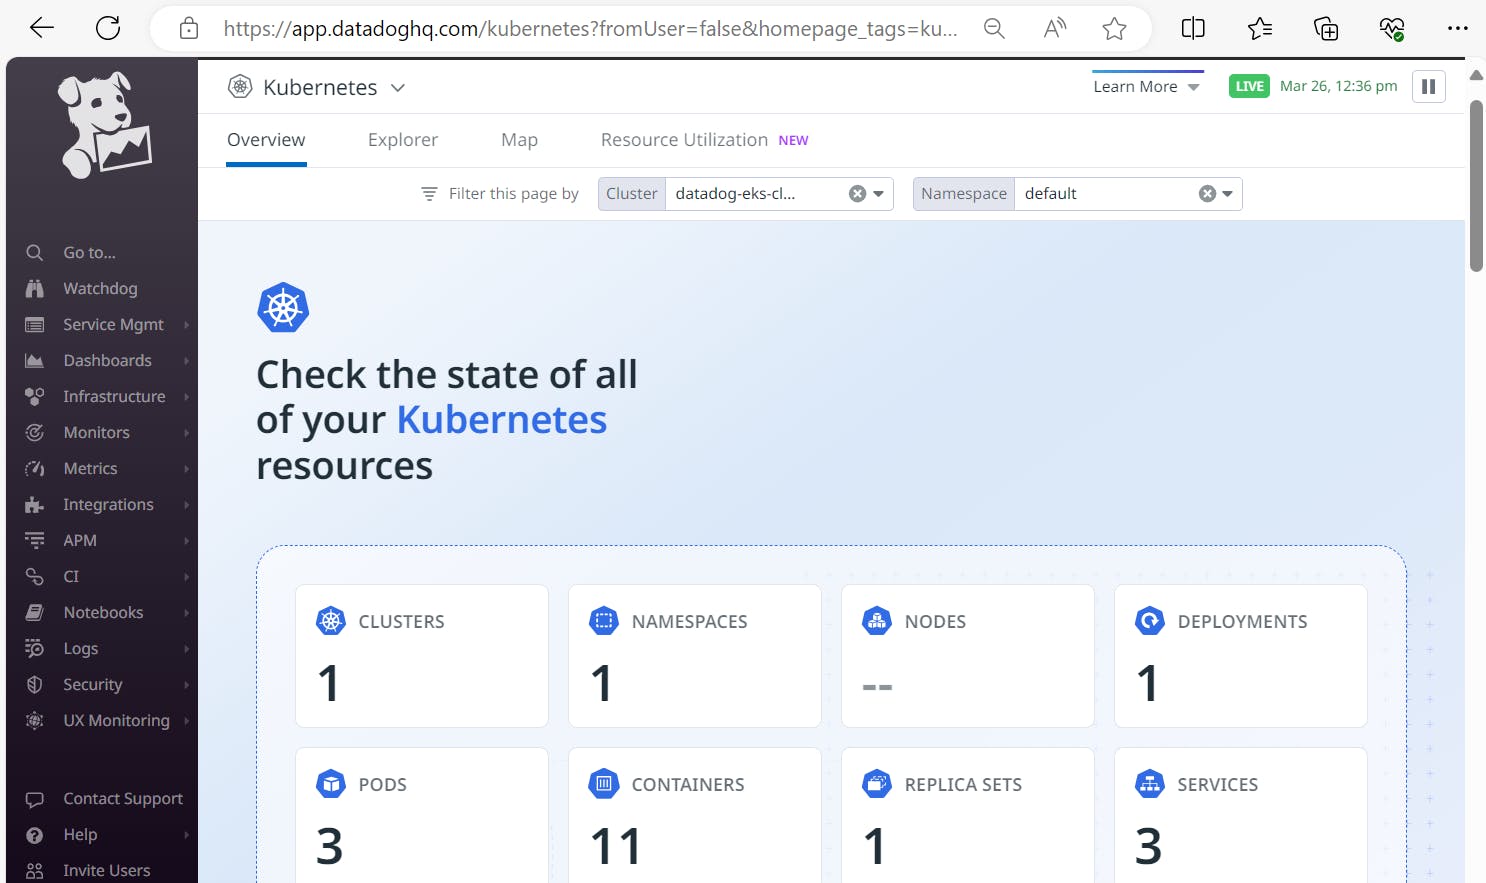
Navigate to Infrastructure list and check the K8s cluster nodes.
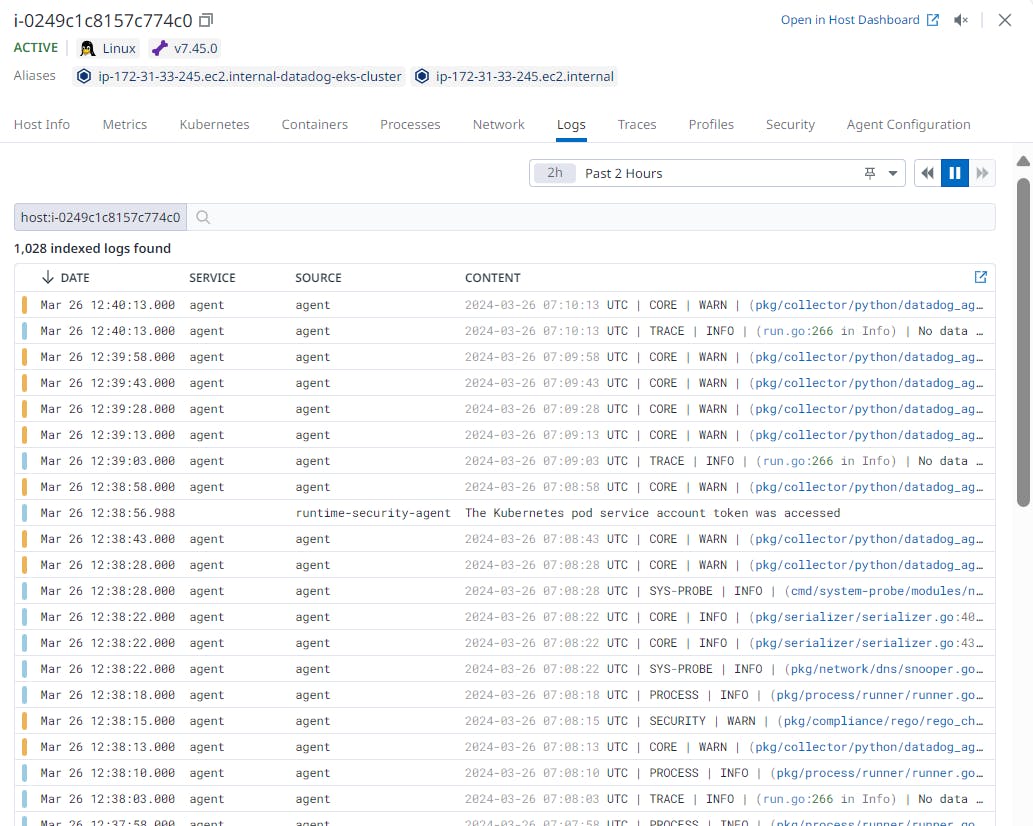
Note: To view the Metrics, Logs and Traces we need to enable "true" indatadog-agent.yamlfile.We can validate the nodes with Metrics, Logs and Traces as shown in below images.
---------- Thank You ------------